| | | | | |  | | | | | |
 | | Keys-wide Comparison: January—June 2025 vs. 2024 | | | | | |
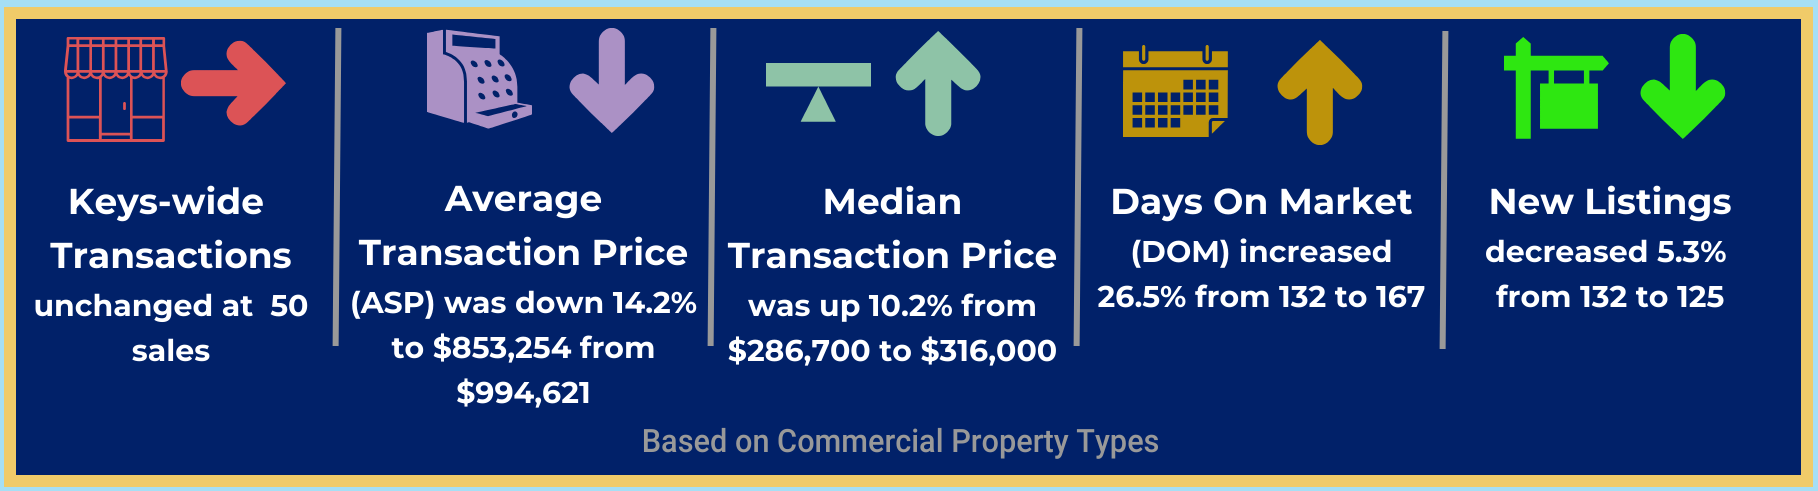
| | | | | | | The commercial real estate market for the Florida Keys comprising leases and sales of commercial real estate from Key Largo to Key West inclusive, accounts for 4.3% of the overall number of real estate transactions and 3.4% of the related Dollar Volume of transactions reported by the MLS services for the first half of 2025. The number of commercial transactions for this period is identical to the same period in 2024. The Dollar Volume in 2025 was off by 14.2%, however, year over year. The small number of commercial transactions in the Florida Keys contributes to the volatility in all of the comparison metrics. It is significant, however, that the number of listed commercial properties is 40.8 % less this year vs. the prior year which is attributable to a number of factors including the uncertain economy and higher commercial loan rates making financing more difficult and costly, sidelining many owners/sellers who view the market as not being favorable for them.
Average sale prices per square foot range significantly from area to area. In Key West, the average cost during this period for commercial space for those sales that reported was $784/square foot while it was $434//square foot in the Lower Keys, $184//square foot in Marathon and $1,118//square foot in the Upper Keys. These sales ranged from retail/office to warehouse to operating restaurants and, therefore, illustrate the gamut of value. The reported lease transactions are even more difficult to decipher because some lease transactions report the monthly rent while others report the total rent over the lease term without identifying the length of the term. Leases also come in a number of variations from gross leases where the landlord pays taxes, insurance and maintenance to triple net leases where the tenant pays those expenses in addition to the rent -details that are not reported in the MLS. All commercial tenants will be enjoying a gift from the Florida Legislature this year as commercial leases will no longer be subject to Florida Sales Tax similar to other States. | | | | | |
| |  | | | | | | | | | | | KEYS-WIDE COMPARISON: LIST PRICE-TO-SALE PRICE | | | | | |
|  | | |
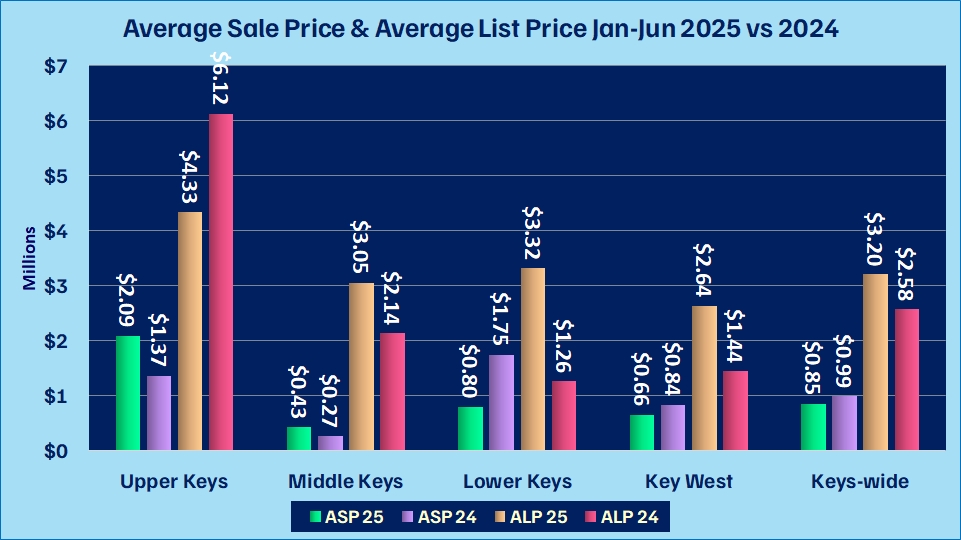
| | | | | | | | Given the comparatively small number of commercial transactions, we often see dramatic swings from one reporting period to the next. The Average Sale Price declined 14% Keys-wide. Gains of 53% and 60%, respectively, in the Upper and Middle Keys were offset by declines of 54% and 22% in the Lower Keys and Key West. The Average List Price gained 24% Keys-wide. The Upper Keys was the only submarket posting a reduction. There were significant increases in the other 3 submarkets. | | | | | |
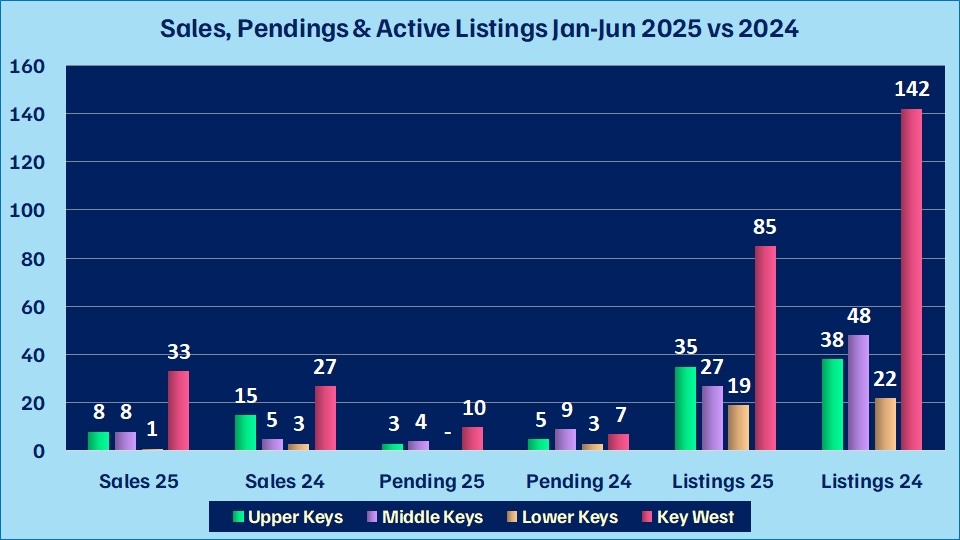
|  | | | | | | | Transaction sides were flat across the Keys but went from 3 to 1 in the Lower Keys and from 15 to 8 in the Upper Keys. The Middle Keys was up 60% and Key West, 22%. Pendings (including Contingent and Contingent-show) were down 29% from a year ago on June 30 with Key West the only submarket to grow. Active listings declined 41% Keys-wide with each submarket down ranging from 8% in the Upper Keys to 44% in the Middle Keys. | | | | | |
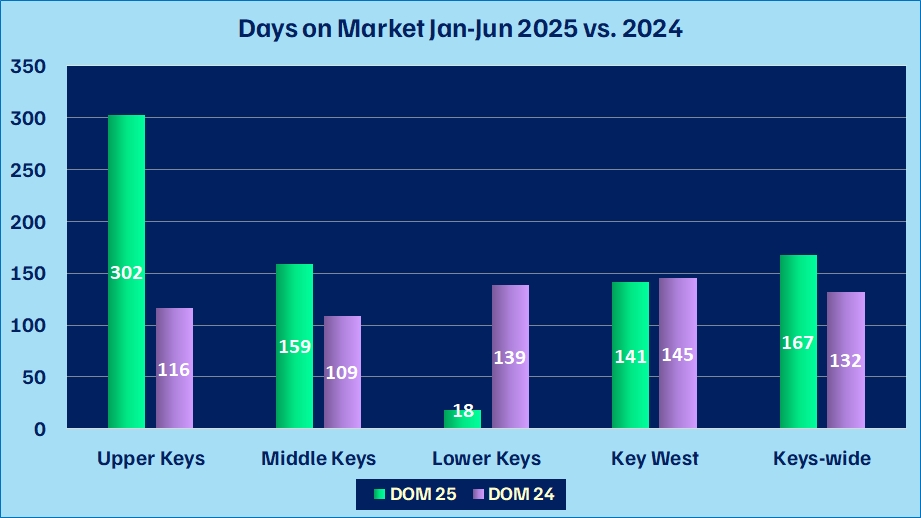
|  | | | | | | | The Days on Market rose 26.5% across the Keys. There was a 160% increase in the Upper Keys (half the number of transactions as in 2024 but with a 53% gain in ASP) and 46% in the Middle Keys where the ASP was up by 60%. The Lower Keys dropped 87% (based on one transaction) and Key West was 3% lower. | | | | | |
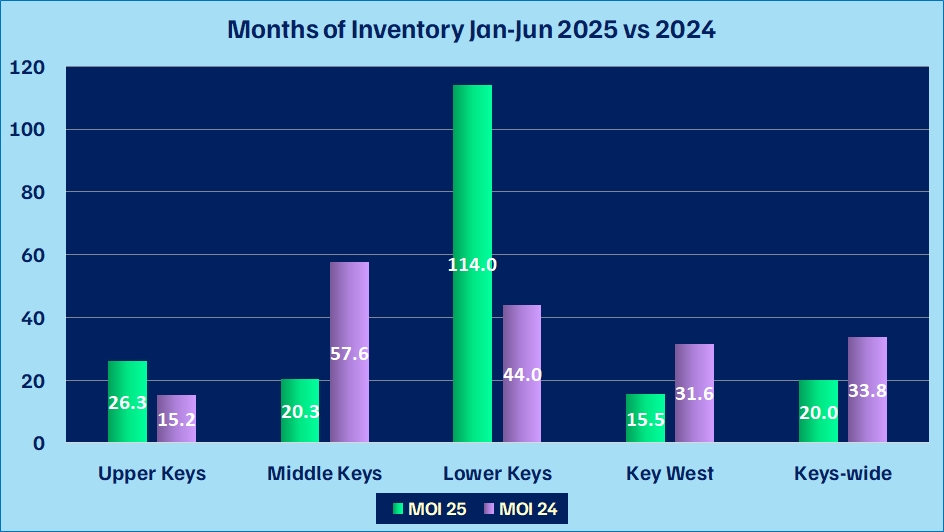
|  | | | | | | | While there are notable differences among the submarkets, the Months of Inventory (also known as the absorption rate) declined by 41% Keys-wide in the first six months of 2025 vs. the same period in 2024. The Upper Keys increased 73%, and the Lower Keys (with only one transaction) jumped 59%, but Key West—the main hub of activity—decreased 51%, and the Middle Keys by 65%. | | | | | |
|  | | | | | | | Summer Surge: Seizing the Seasonal Edge in Commercial | | | | | |
| | | | | | | Summer isn't slow in commercial real estate. It's a sprint. The volume of tenant tours often jumps from June through August, with lease signings peaking in late July. Mid-year planning cycles, longer daylight hours for site visits, and the race to lock in leases before fall drive serious momentum.
Medical practices rush to establish new clinics before patient volume spikes in the fall. Foot traffic surges in tourist-heavy metros, powering demand for urban storefronts. Outdoor dining and entertainment spaces become magnets for consumer spending, driving landlords to activate underused square footage. Warehouses fill early as logistics firms and e-commerce brands prep for Q4 shipping. Savvy tenants know summer is the moment to secure space before inventory season hits. In the office sector, Class A properties—often with sub-10% vacancy—move fast. Many are now offering shorter-term incentives or turnkey spaces to accelerate lease-up.
Why It Matters Now: Summer isn’t a lull—it’s a lever. Move now, and you can:
-- Lock in better rates before Q4 pressure rises
-- Boost visibility with peak seasonal traffic
-- Get ahead of the competition on prime space
-- Capture momentum tied to economic mid-year pivots
In commercial leasing, summer is the season to act—not wait. | | | | | |
|
|
|
|---|
|
|
| | | | | | From Underdog to Outperformer: CRE’s Midyear Power Play | | | | | |
| | | | | | | As the midpoint of 2025 nears, commercial real estate (CRE) is emerging as the unexpected market standout—outperforming even residential housing in total returns.
According to a recent research report from Principal Asset Management, this marks a rare divergence: Since Q1 2023, CRE returns and housing prices—historically aligned—have split dramatically. CRE total returns turned positive in 4Q24, hitting 2.8% in Q1?2025, while housing slowed to just 3.4% growth over the same period.
What makes this remarkable is that it’s happening outside a recession—something that’s only occurred about 20% of the time since the late 1980s. Looking forward, Principal forecasts CRE total returns to reach roughly 5% in 2025, driven by steady income amid muted capital gains. Over the next five years, they expect annualized returns to rise to about 7%, and possibly 8–9% over a decade—approaching pre-GFC performance levels. These trends are rooted in shifting tenant demand, rising interest rates, and tighter financing. CRE is now being priced on income and precision—targeting smaller, high-grade, and well-located assets. Meanwhile, housing is cooling under affordability pressures and low inventory, especially in overheated Sunbelt markets.
What does this mean for investors at midyear 2025? First, that CRE is not just rebounding—it’s rewriting real estate playbooks. And strong operating fundamentals, resilient income streams, and a shift to smaller, smarter assets suggest a new cycle where CRE could significantly outpace housing returns. | | | | | |
|
|
|
|---|
|
|
| | | | | | COMMERCIAL TRANSACTIONS OF
2025’S FIRST HALF | | | | | |
|
|
|
|---|
|
|
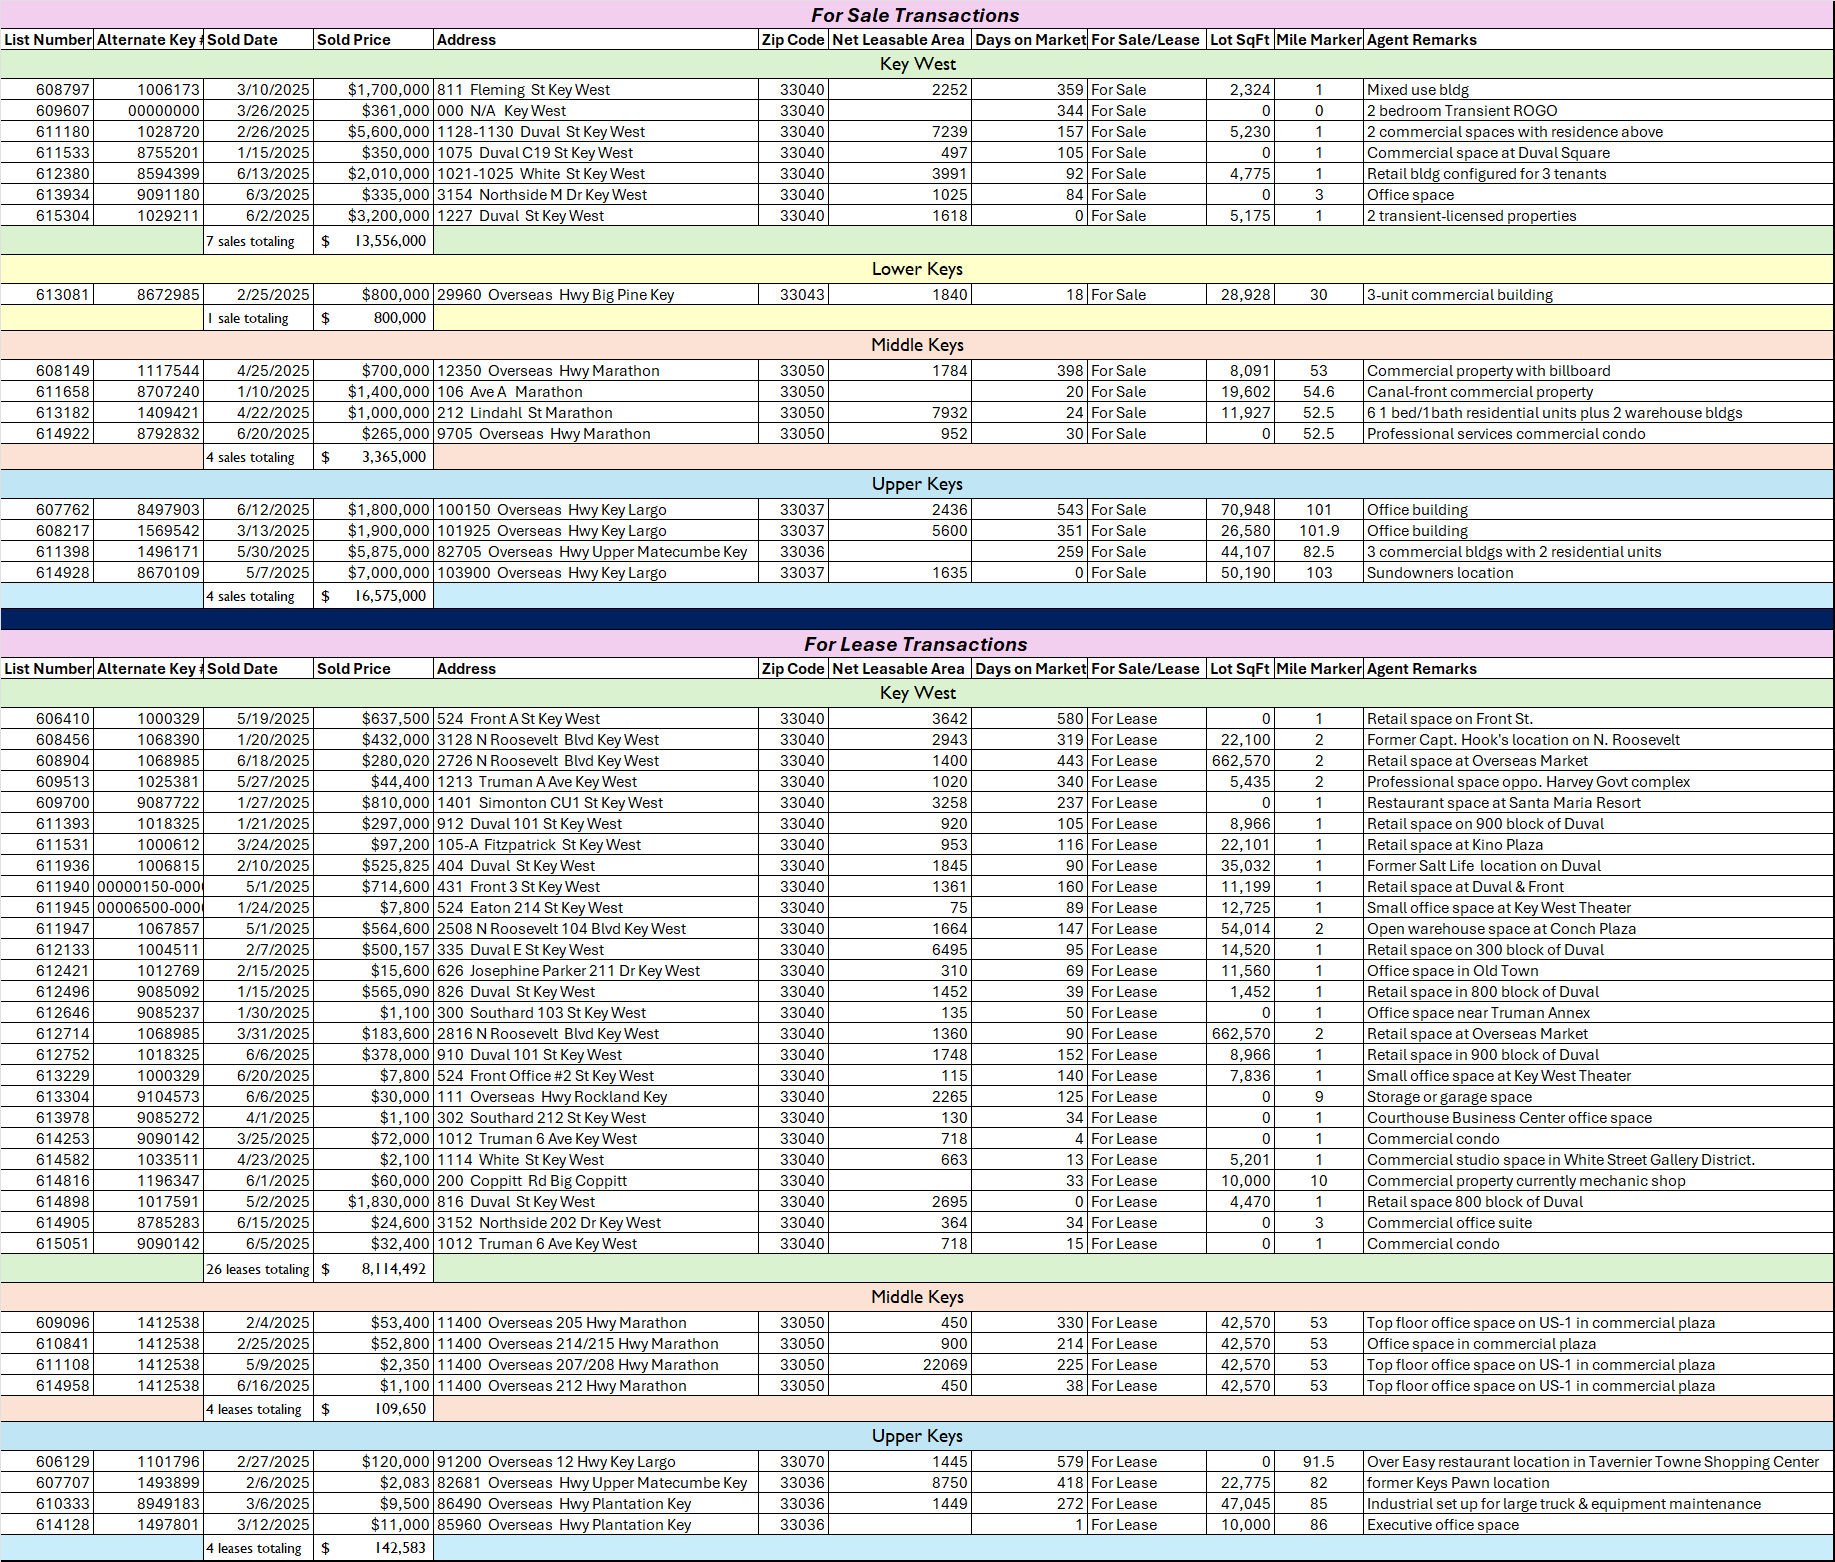
| | | | | | There were 50 closed commercial transactions recorded in the Keys MLS for areas 1-27 plus offshore islands between January 1 and June 30, 2025. There were 16 For Sale transactions with a total dollar volume of $47,020,000. There were 34 transactions involving commercial leases for a total dollar volume of $8,366,725.
The following table lists the first half of 2025’s commercial For Sale and For Lease transactions by dollar volume. They are grouped by submarket area and include the MLS#, alternate key number (to allow you to search the Property Appraiser’s website for more detail), the sold date, sold price, DOM, address, net leasable area, mile marker, and a brief description.
| | | | | |
|
|
|
|---|
|
|
| | | | | |  | | | | | |
|
|
|
|---|
|
|
| | | | | |  | | | | | |
|
|
|
|---|
|
|
Coldwell Banker Schmitt Real Estate Co. |
| 11100 Overseas Highway, Marathon, FL 33050 |
| | | | |
|
|
|---|
|
|
Coldwell Banker Schmitt Commercial Report Sign up |
|
|